In this post we will look at steps involved in profiling of the CUDA code using Nvidia Nsight Systems.
Let’s take a simple code which performs some array operations.
#include<stdio.h>
#include<stdlib.h>

#define ARRSIZE 9999999
#define NUM_THDS_PER_BLOCK 256

void print_data(int *C)
{
	int i;
	//print the data
	printf("\tC Array values : ");
	for(i=0;i<ARRSIZE;i++)
	{
		printf("\t%d ", C[i]);
	}
}

void initialize(int *A, int *B, int *C)
{
	int i;
	//Initialize data to some value
	for(i=0;i<ARRSIZE;i++)
	{
		A[i] = 2*(i+1);
		B[i] = i+1;
	}
}

__global__ void add_arrays(int *A, int *B, int *C)
{
	int i = blockIdx.x*blockDim.x + threadIdx.x;
	if(i<ARRSIZE)
	{
		C[i] = A[i] + B[i];
	}
}

__global__ void sub_arrays(int *A, int *B, int *C)
{
	int i = blockIdx.x*blockDim.x + threadIdx.x;
	if(i<ARRSIZE)
	{
		C[i] = A[i] - B[i];
	}
}


__global__ void mul_arrays(int *A, int *B, int *C)
{
	int i = blockIdx.x*blockDim.x + threadIdx.x;
	if(i<ARRSIZE)
	{
		C[i] = A[i] * B[i];
	}
}

__global__ void div_arrays(int *A, int *B, int *C)
{
	int i = blockIdx.x*blockDim.x + threadIdx.x;
	if(i<ARRSIZE)
	{
		C[i] = A[i] / B[i];
	}
}


int main(int argc, char **argv)
{
	int *A, *B, *C;
	int *A_d, *B_d, *C_d;
	int num_threads_per_block, total_threads, num_blocks;

	//Allocate and initialize the arrays
	A = (int *)malloc(ARRSIZE*sizeof(int));
	B = (int *)malloc(ARRSIZE*sizeof(int));
	C = (int *)malloc(ARRSIZE*sizeof(int));

	initialize(A,B,C);

	//print the data
	//printf("\nInitial data: \n");
	//for(i=0;i<ARRSIZE;i++)
	//{
	//	printf("\t%d \t %d\n", A[i], B[i]);
	//}

	num_threads_per_block = NUM_THDS_PER_BLOCK;
	total_threads = ARRSIZE;
	num_blocks = total_threads / num_threads_per_block + 1;

	cudaMalloc(&A_d, ARRSIZE*sizeof(int));
	cudaMemcpy(A_d, A, ARRSIZE*sizeof(int), cudaMemcpyHostToDevice);

	cudaMalloc(&B_d, ARRSIZE*sizeof(int));
	cudaMemcpy(B_d, B, ARRSIZE*sizeof(int), cudaMemcpyHostToDevice);

	cudaMalloc(&C_d, ARRSIZE*sizeof(int));

	add_arrays<<<num_blocks,num_threads_per_block>>>(A_d,B_d,C_d);

	sub_arrays<<<num_blocks,num_threads_per_block>>>(A_d,B_d,C_d);

	mul_arrays<<<num_blocks,num_threads_per_block>>>(A_d,B_d,C_d);

	div_arrays<<<num_blocks,num_threads_per_block>>>(A_d,B_d,C_d);

	cudaMemcpy(C, C_d, ARRSIZE*sizeof(int), cudaMemcpyDeviceToHost);

	//print_data(C);

	printf("\nProgram exit!\n");

	//Free arrays
	cudaFree(A_d);
	cudaFree(B_d);
	cudaFree(C_d);
	free(A);
	free(B);
	free(C);
}
To compile this code, we can use following command. Please note that I am using “-arch=sm_86” which instructs compiler to generate code for compute capability 8.6 (for the GPU I have). You may find out compute capability for your GPU here or can skip this option.
nvcc array_operations.cu -arch=sm_86We can run this code using “./a.out”. The command for profiling the code is as following. Alternatively you can use “nsys-ui” command to open the GUI and profile the code.
nsys profile ./a.outAfter the profiling is complete, the report can be opened using Nvidia Nsight System’s GUI using following command
nsys-ui report1.nsys-repHere, “report1.nsys-rep” is the name of the output file generated after profiling is successful. You can replace this name with the your report filename.
After opening the GUI, you should see following window –
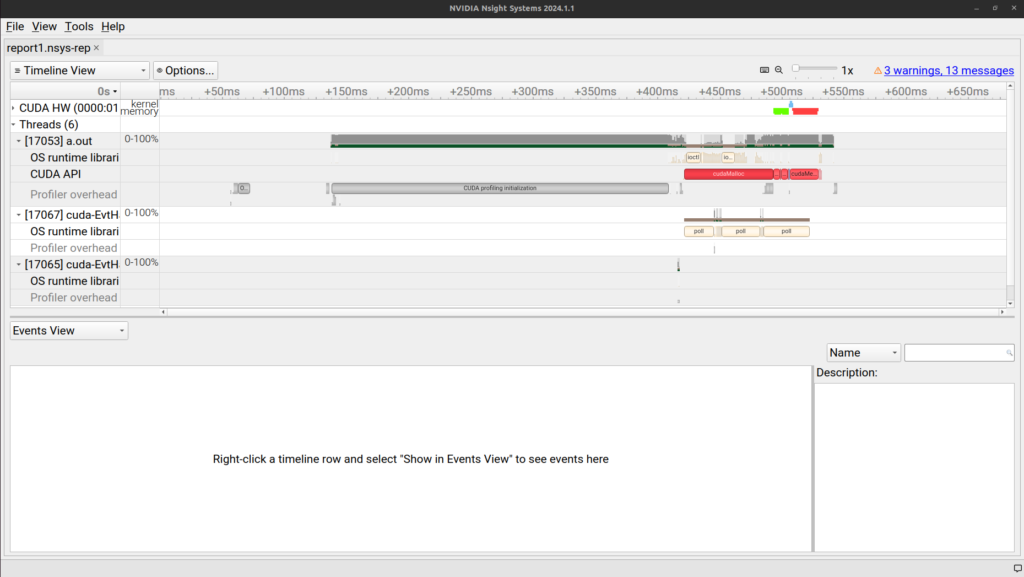
This shows the timeline for overall execution of the code and all the activities capture during execution of this code.
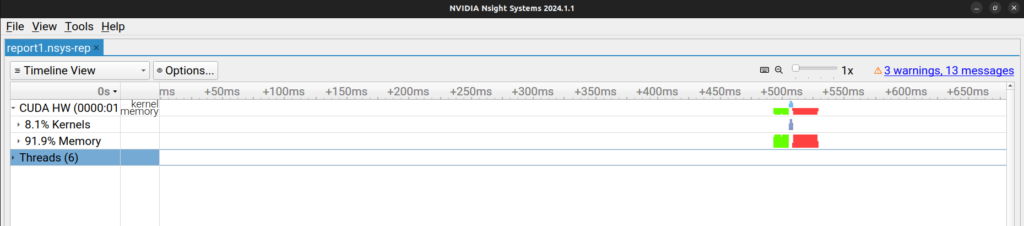
On the Left hand side we can hide the “Threads” row and expand the “CUDA HW” row by clicking on the little triangular icon before. By further expanding “Kernels” and “Memory” (will be visible after expanding “CUDA HW”), you will see something like this –
We can expand “Kernels” further and select a only colored portion (around 500ms mark). To select and zoom onto this colored portion, click and drag to select this portion. Right click on the selected portion and click on zoom into the selection. You should be able to see something like this –
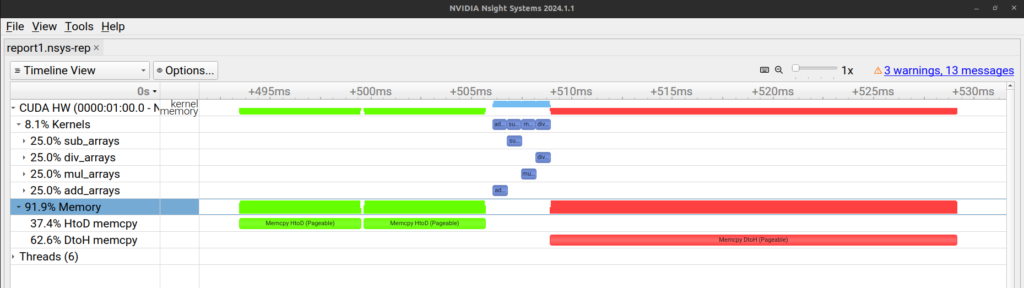
Here, we can see different CUDA kernels and memory transfers on the timeline. If we move our cursor over a kernel, we can see more details.
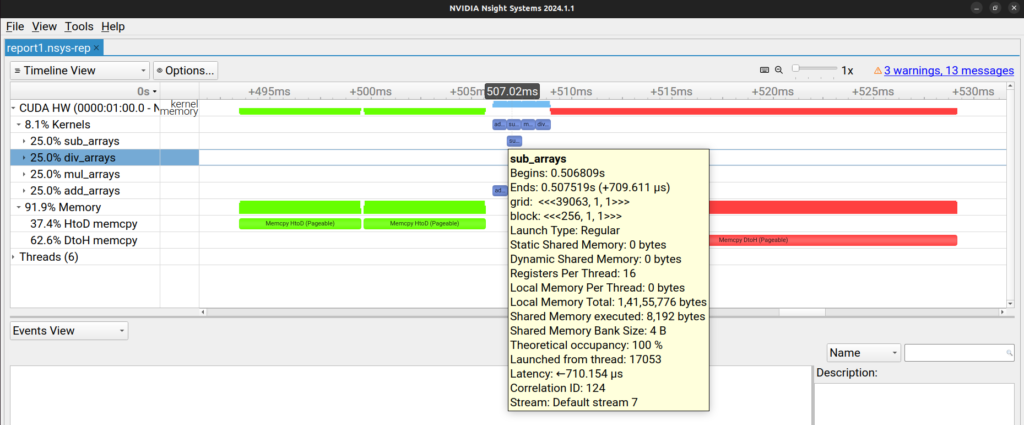
Similarly at the bottom half of the the tool we can select “Events View” and other options to get more details.
References: