Profiling your OpenACC code on a remote system can be tricky sometimes. Many times we try to profile the code in cluster environment where we need to use a job scheduler to submit our jobs. In such scenarios, command line based profiling comes handy.
This tutorials provides some usage examples for NVIDIA’s command line profiler – nvprof
Following is the basic usage of nvprof
nvprof ./a.out I have shared sample profiling output for one of the OpenACC code here –
==6405== NVPROF is profiling process 6405, command: ./a.out
 Value of pi is :     3.141593
 Execution time :    0.3913819789886475       seconds
==6405== Profiling application: ./a.out
==6405== Profiling result:
            Type  Time(%)      Time     Calls       Avg       Min       Max  Name
 GPU activities:   99.95%  112.21ms         1  112.21ms  112.21ms  112.21ms  pi_calc_17_gpu
                    0.05%  50.912us         1  50.912us  50.912us  50.912us  pi_calc_17_gpu__red
                    0.00%  3.2960us         1  3.2960us  3.2960us  3.2960us  [CUDA memset]
                    0.00%  1.6960us         1  1.6960us  1.6960us  1.6960us  [CUDA memcpy DtoH]
      API calls:   50.56%  132.90ms         1  132.90ms  132.90ms  132.90ms  cuDevicePrimaryCtxRetain
                   42.71%  112.28ms         3  37.425ms  5.1090us  112.26ms  cuStreamSynchronize
                    6.40%  16.819ms         1  16.819ms  16.819ms  16.819ms  cuMemHostAlloc
                    0.14%  374.98us         1  374.98us  374.98us  374.98us  cuMemAllocHost
                    0.08%  222.65us         3  74.216us  6.7530us  111.74us  cuMemAlloc
                    0.07%  173.70us         1  173.70us  173.70us  173.70us  cuModuleLoadDataEx
                    0.01%  25.777us         2  12.888us  6.1510us  19.626us  cuLaunchKernel
                    0.01%  22.514us         1  22.514us  22.514us  22.514us  cuMemcpyDtoHAsync
                    0.00%  11.347us         1  11.347us  11.347us  11.347us  cuStreamCreate
                    0.00%  8.9010us         1  8.9010us  8.9010us  8.9010us  cuMemsetD32Async
                    0.00%  3.6610us         1  3.6610us  3.6610us  3.6610us  cuDeviceGetPCIBusId
                    0.00%  3.3190us         1  3.3190us  3.3190us  3.3190us  cuEventRecord
                    0.00%  2.6890us         2  1.3440us     413ns  2.2760us  cuEventCreate
                    0.00%  2.2660us         3     755ns     298ns  1.2790us  cuCtxSetCurrent
                    0.00%  2.1290us         3     709ns     269ns  1.2060us  cuDeviceGetCount
                    0.00%  1.7620us         5     352ns     237ns     454ns  cuDeviceGetAttribute
                    0.00%  1.6410us         1  1.6410us  1.6410us  1.6410us  cuPointerGetAttributes
                    0.00%  1.1130us         1  1.1130us  1.1130us  1.1130us  cuEventSynchronize
                    0.00%  1.0150us         2     507ns     248ns     767ns  cuModuleGetFunction
                    0.00%     940ns         2     470ns     216ns     724ns  cuDeviceGet
                    0.00%     297ns         1     297ns     297ns     297ns  cuDeviceComputeCapability
                    0.00%     285ns         1     285ns     285ns     285ns  cuCtxGetCurrent
                    0.00%     263ns         1     263ns     263ns     263ns  cuDriverGetVersion
 OpenACC (excl):   86.63%  112.28ms         2  56.139ms  9.2280us  112.27ms  acc_wait@pi_calc.f90:17
                   13.01%  16.860ms         1  16.860ms  16.860ms  16.860ms  acc_exit_data@pi_calc.f90:17
                    0.15%  198.14us         1  198.14us  198.14us  198.14us  acc_device_init@pi_calc.f90:17
                    0.09%  121.69us         1  121.69us  121.69us  121.69us  acc_compute_construct@pi_calc.f90:17
                    0.04%  50.844us         1  50.844us  50.844us  50.844us  acc_enter_data@pi_calc.f90:17
                    0.03%  41.963us         1  41.963us  41.963us  41.963us  acc_enqueue_download@pi_calc.f90:23
                    0.02%  23.683us         1  23.683us  23.683us  23.683us  acc_enqueue_launch@pi_calc.f90:17 (pi_calc_17_gpu)
                    0.01%  11.535us         1  11.535us  11.535us  11.535us  acc_wait@pi_calc.f90:23
                    0.01%  10.588us         1  10.588us  10.588us  10.588us  acc_enqueue_upload@pi_calc.f90:17
                    0.01%  7.7160us         1  7.7160us  7.7160us  7.7160us  acc_enqueue_launch@pi_calc.f90:17 (pi_calc_17_gpu__red)
                    0.00%       0ns         1       0ns       0ns       0ns  acc_delete@pi_calc.f90:23
                    0.00%       0ns         1       0ns       0ns       0ns  acc_alloc@pi_calc.f90:17
                    0.00%       0ns         1       0ns       0ns       0ns  acc_create@pi_calc.f90:17
If we want to visualize nvprof profiling output using NVIDIA’s visual profiler (nvvp), we can store the profiling output to a file.
nvprof -o profile_output.nvvp ./a.outNVIDIA’s Visual Profiler (‘nvvp’) can be used for opening this profiler output (‘profile_output.nvvp’) file (File -> Open).
Also, we can perform detailed analysis for a specific kernel using following command where ‘pi_calc_17_gpu’ is the name of the kernel we are trying to get detailed analysis on. Also, please note that as it is trying to generate detailed analysis for the given kernel, it will take considerable amount of time for following command.
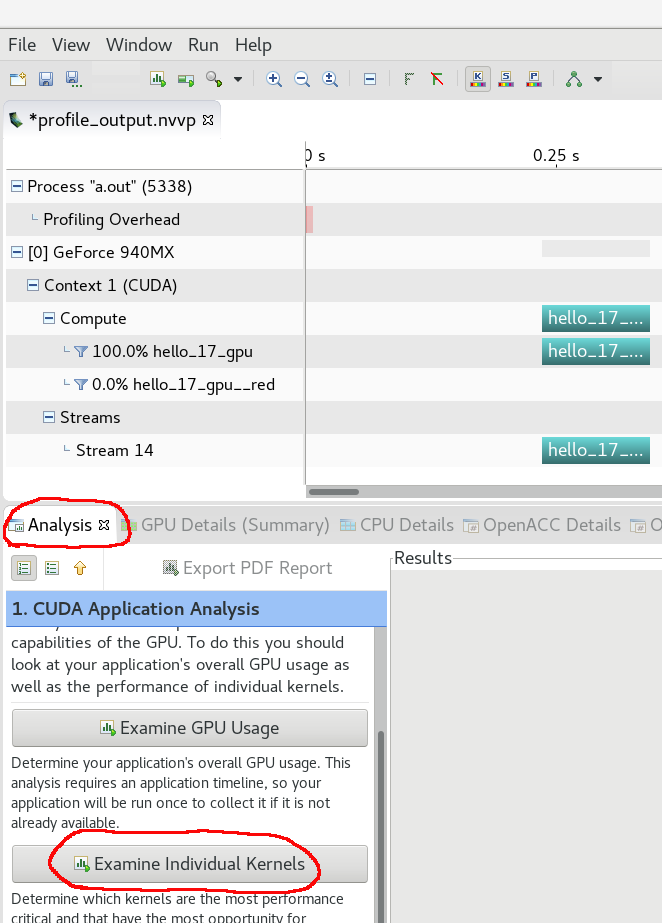
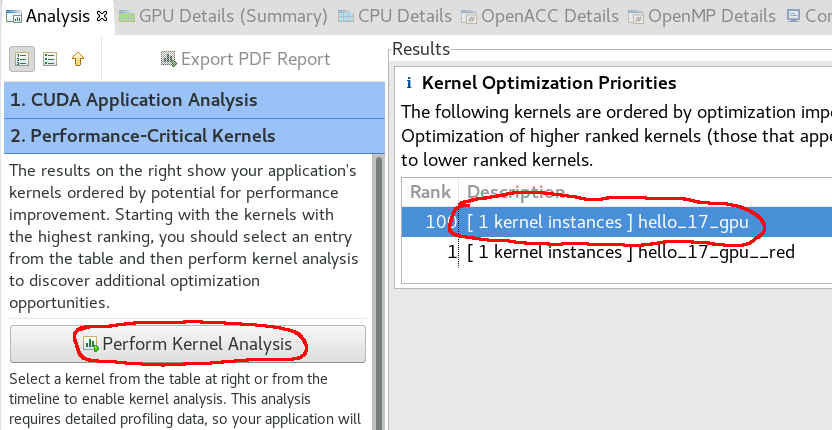
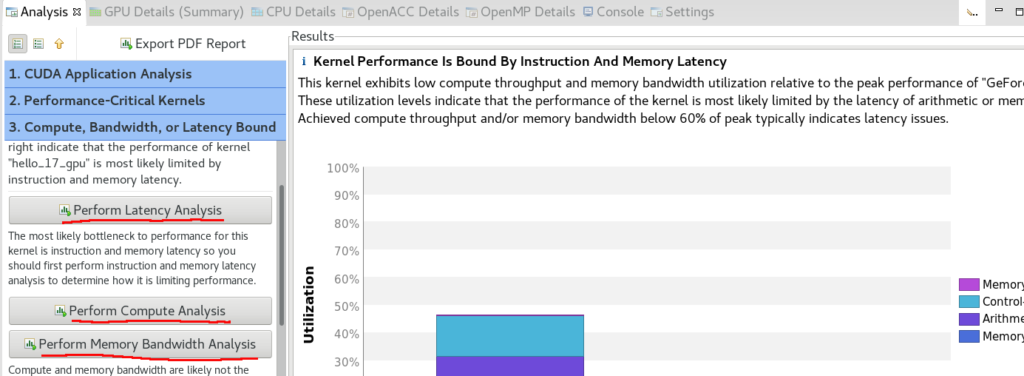
nvprof -o profile_output_detailed.nvvp --analysis-metrics --kernels pi_calc_17_gpu ./a.outAs mentioned before, this ‘profile_output_detailed.nvvp’ file can be opened using NVIDIA’s Visual Profiler – ‘nvvp’. For visualization of the all the additional details (that we just collected), we will have to follow following steps –
Step 1:

Step 2:

Step 3:

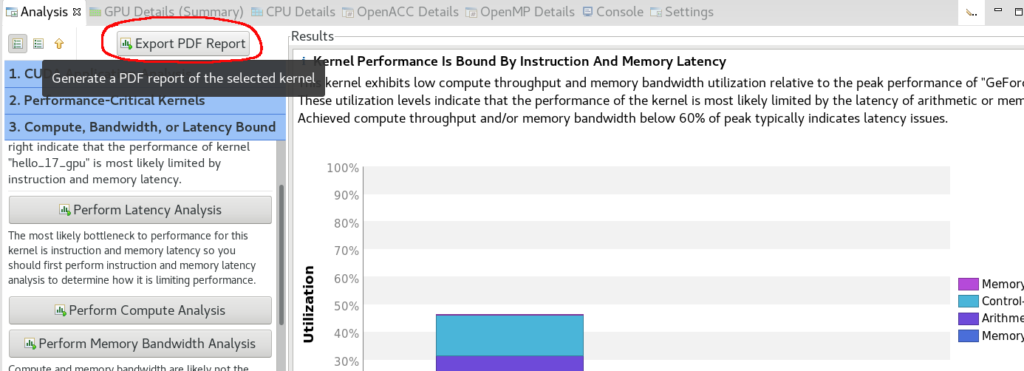
Step 4 (optional):

At the end of the step 4, we will have a PDF report generated for the detailed analysis of the given kernel.
Note: NVVP and NVPROF are deprecated and will not be supported in future versions of CUDA toolkit. Users are recommended to migrate to new set of NVIDIA Developer tools. These tools can be downloaded separately or can be downloaded as a part of NVIDIA HPC SDK.
